When Bob and Carl came out with this new theory on 160 m. propagation (published on CQ Magazine – November 2008), they asked to the Topband community to help with log data on the very long distance contacts.
I extracted on new spreadsheets all my worked and heard QSOs with New Zealand and Australia, completed with the signal strengths, and tried to get a correlation with the Galactic Cosmic Rays data available on the Neutron Monitors.
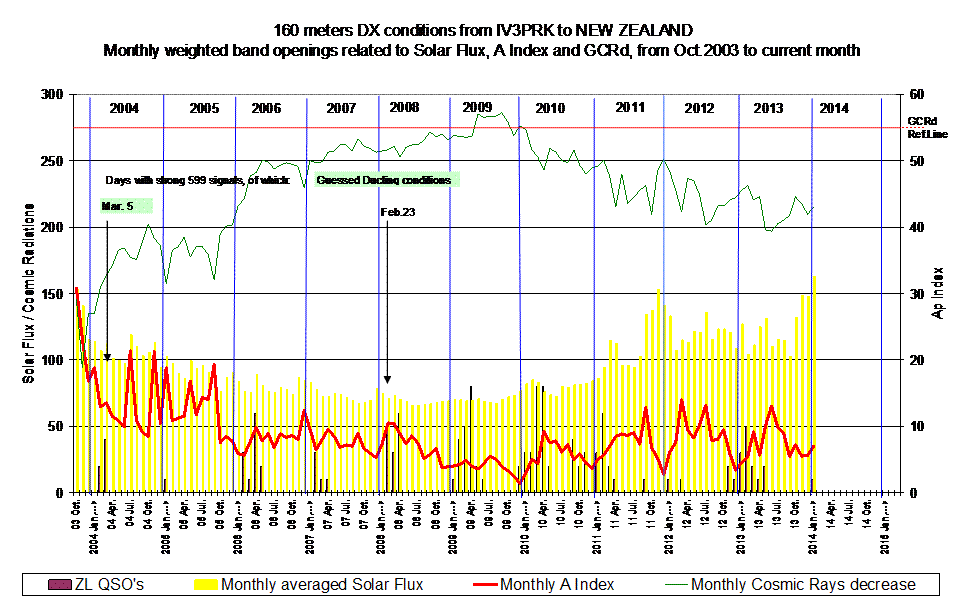
I superimposed the monthly GCR decrease line on all my graphs, where we can see that the Galactic Cosmic radiation is out of phase with the Solar Cycle. So, at solar cycle minimum the cosmic rays are maximum, and with increasing sunspots activity they are shift away from the Earth and that’s given by the “decrease” percent number. See further comments on this page.
We see that since May 2009 the cosmic radiations have been “above” the reference decrease line, thus strong and quite unusual, for the first time in the last 40 years. What correlation with 160 m. propagation can be found? The good propagation we enjoyed with the Pacific area in the last period is just opposite to the above ducting theory.
It’s clear that long DX ducting propagation can be influenced by GCR decrease only during the solar maximum years. So, as K9LA said, there should be something else in the lower ionosphere which influences 160 m. propagation, but we don’t have yet a direct parameter.

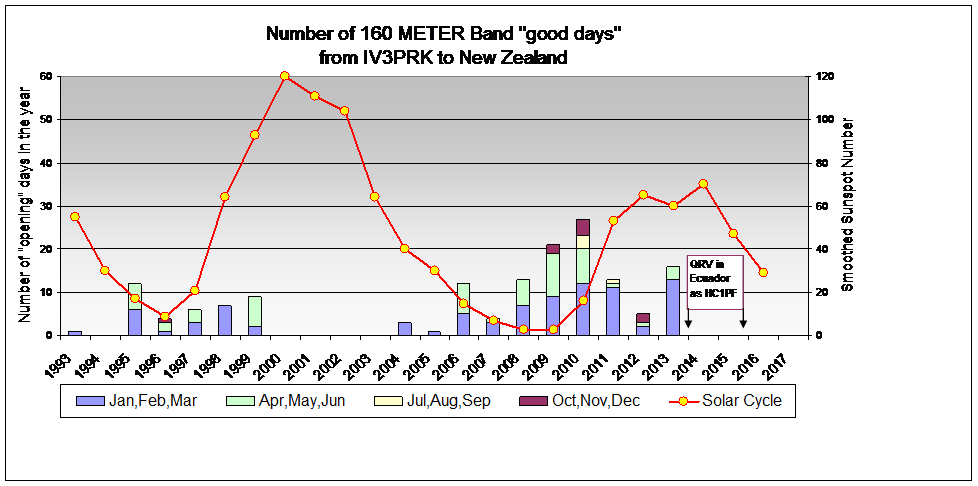
Just a note here: in the years from 1993 to 1999 the most active stations from New Zealand were ZL2JR and ZL4WA, while in the current cycle, since 2004, the most regular one is Greg, ZL3IX, with very good receiving antennas in a remote setup.
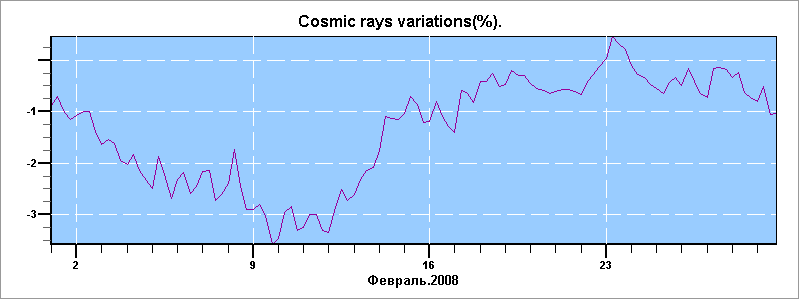
Going through the detailed log data I found two days with exceptional “loud” signals for such a distance, above 18.000 km. Only one of them, the March 5th 2004, with a GCRd of -12, could has been under “ducting” conditions.
The other one, on Feb. 23 2008, shows a correlation with an exceptional positive GCR peak, and it needs to be further investigated. Down here we see the daily GCR decrease data for February 2008 from the Moscow Neutron Monitor.
The next graph is one of my usual ones, counting the number of open days, no matter how strong was the opening. Again, this graph is mostly influenced by the daily regular activity of ZL3IX, Tnx Greg!
Noteworthy the openings in the Fall season, which never happened before with ZL, despite the worsening of conditions on all other paths.
See also the graphs with peaking time of the openings here.