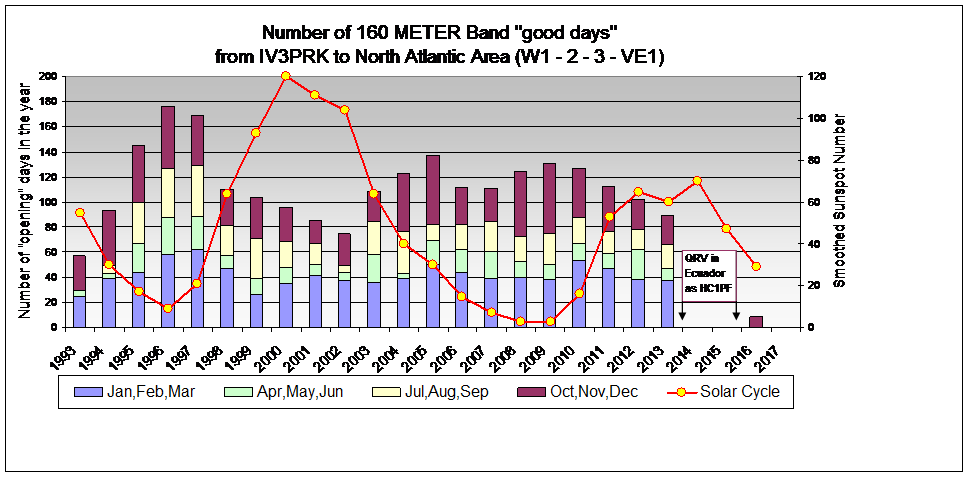
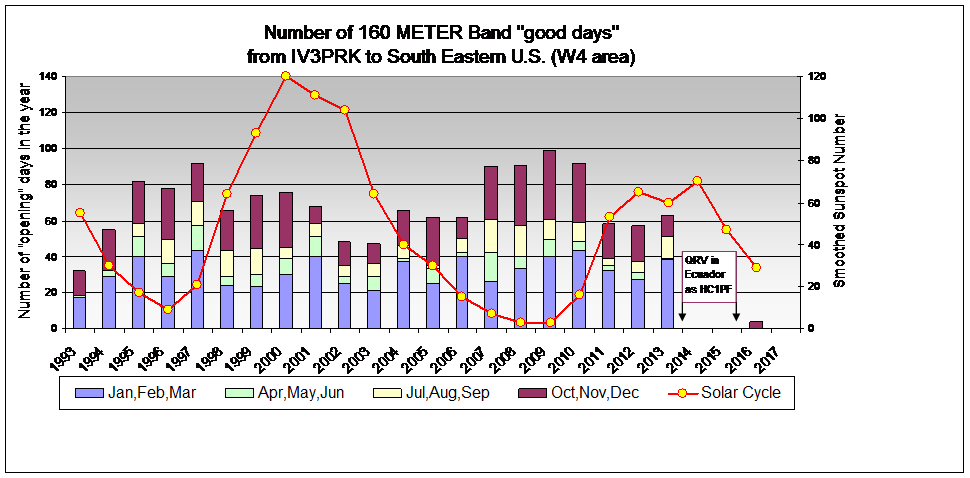
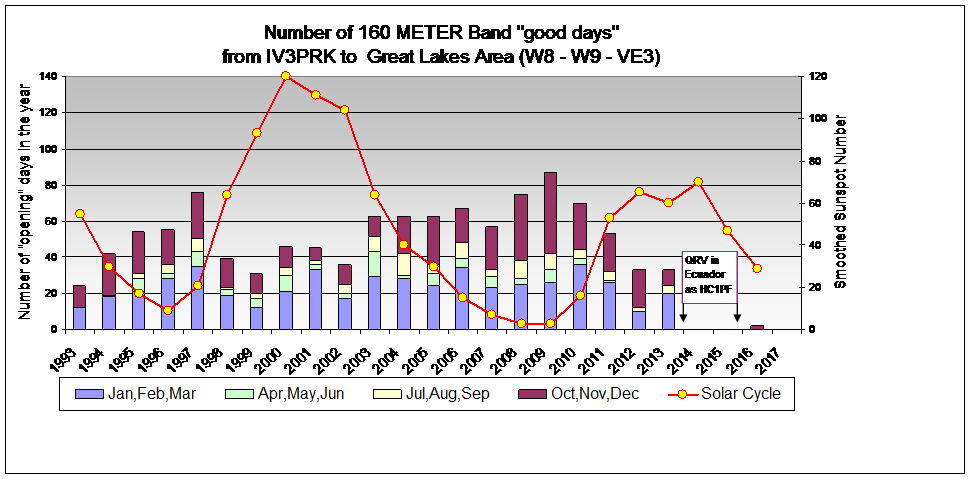
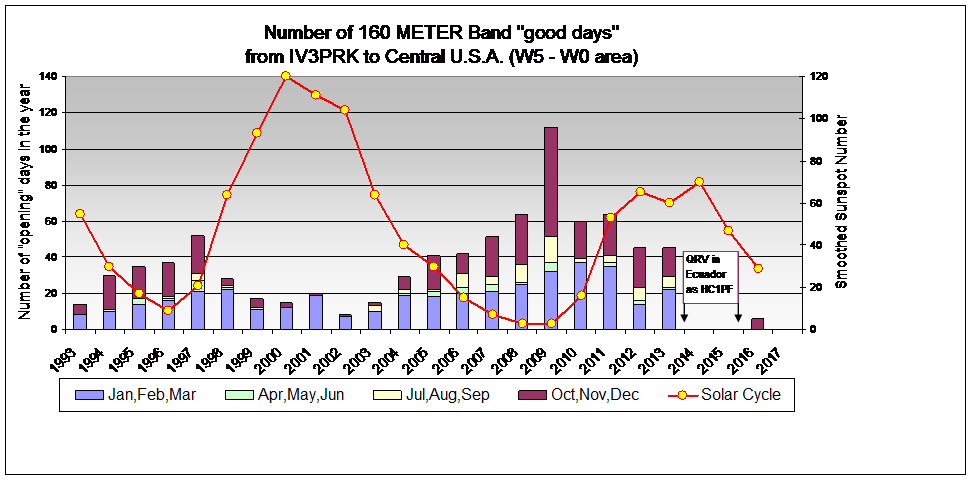
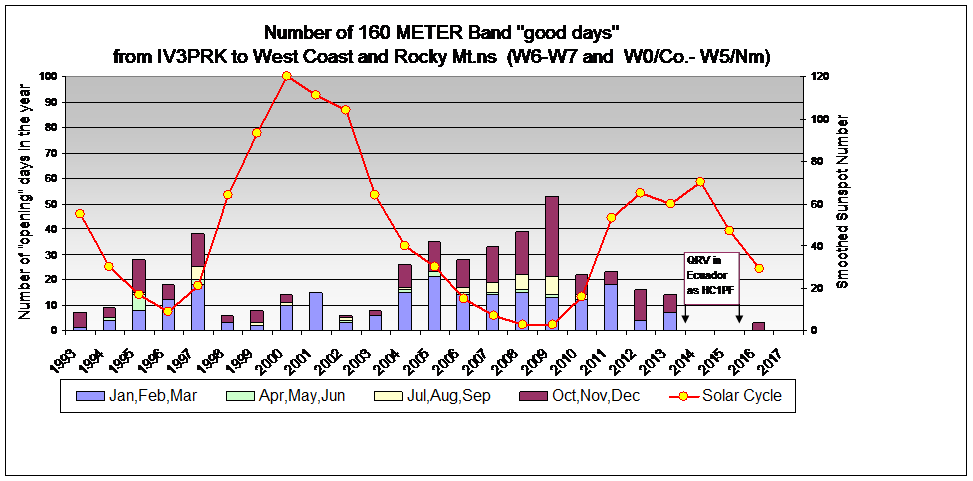
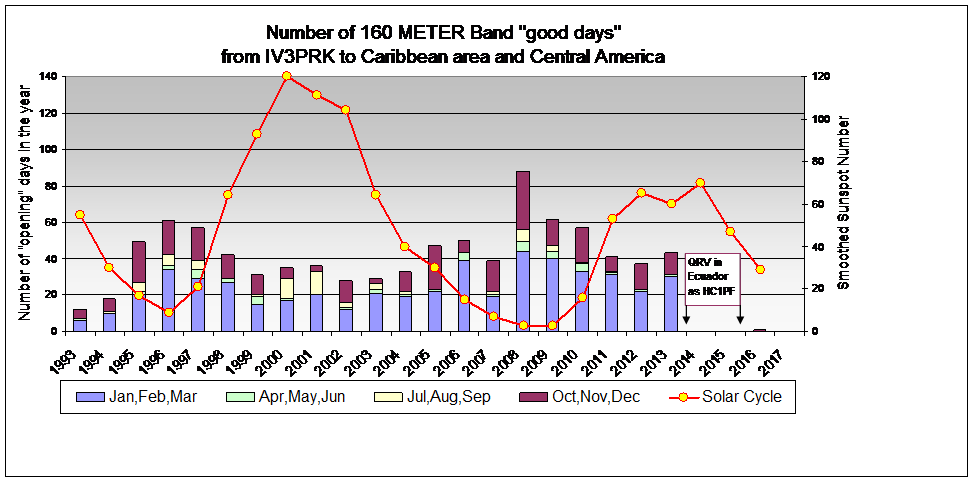
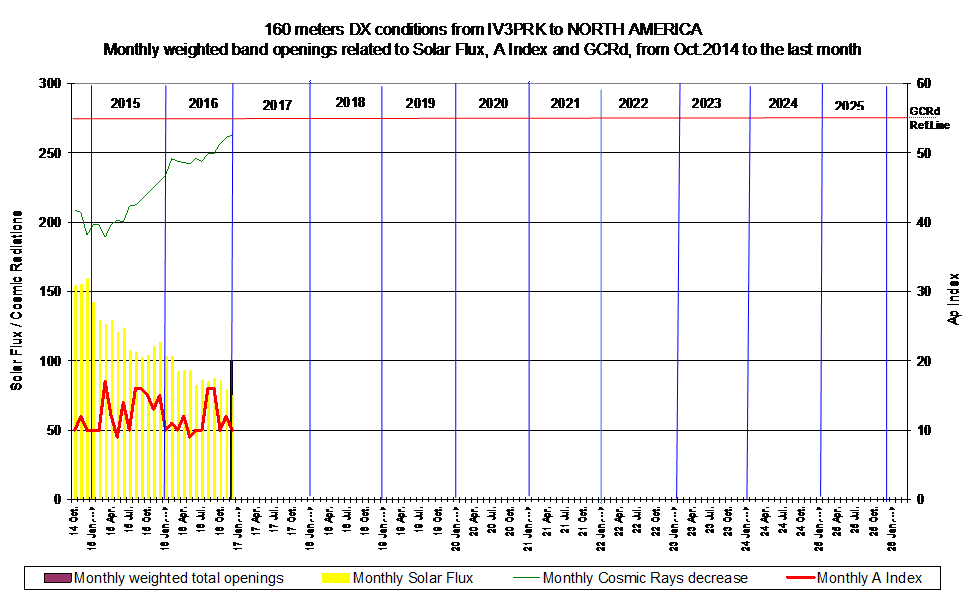
The following graphs are extracted from my daily rating system. See full explanations on DAILY DX conditions page.
The left scale reports the Solar Flux and the Galactic Cosmic radiations; the right one magnifies the monthly median 24 hours Ap Index.
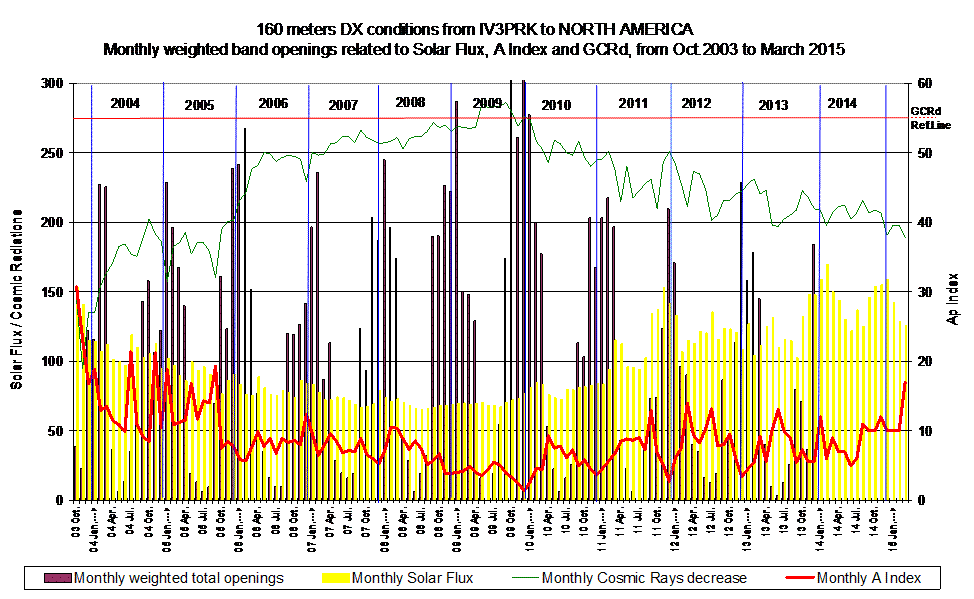
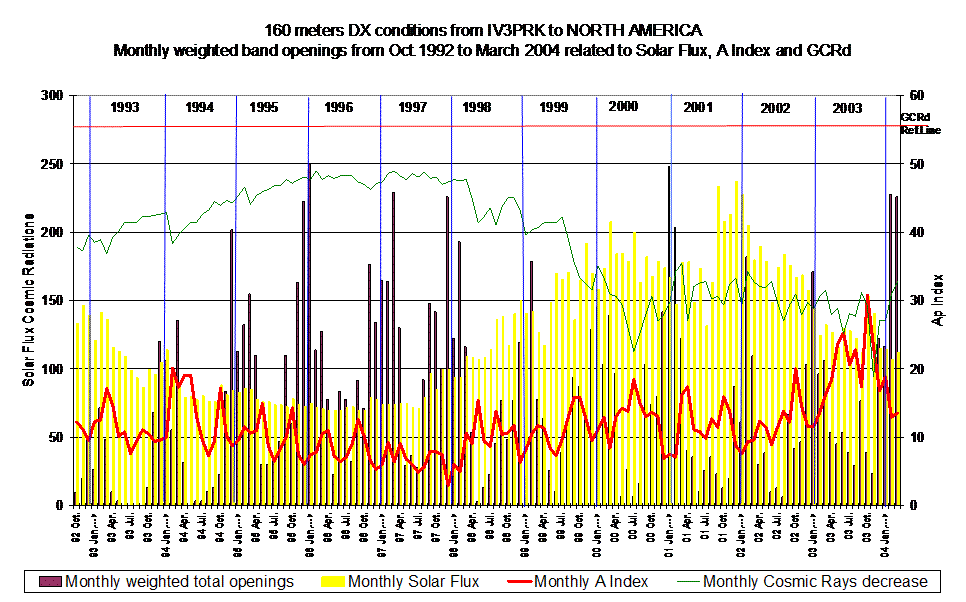
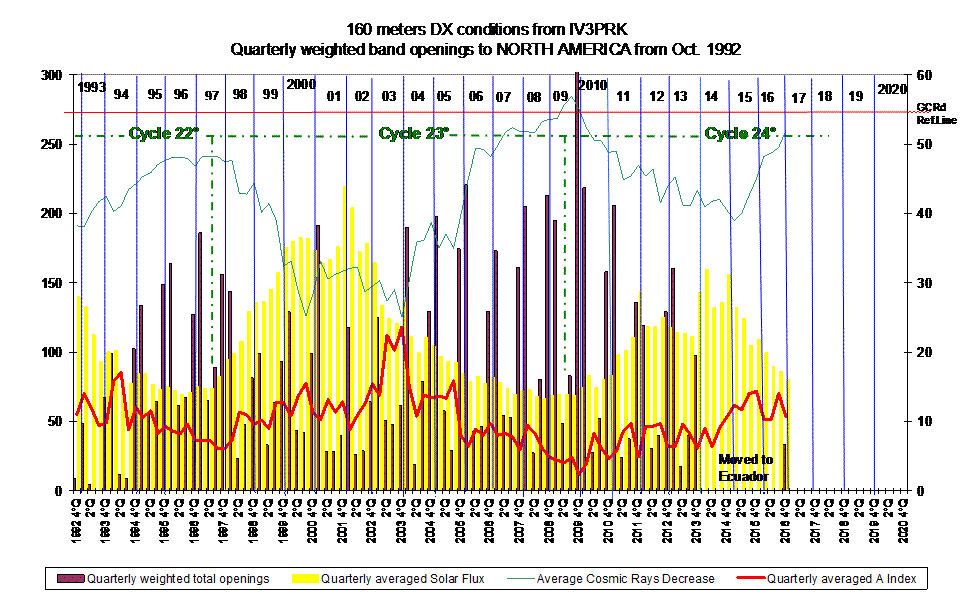
On the next graph the same data are grouped into three months columns to get a better view through the solar cycles.
The following graphs are extracted from a data base with the peaking time of the opening. Only one time for each day is recorded and the number of open days is counted. See the time graphs on this page.
Thus the number on the left column indicates the number of days with an opening, weak or strong, no difference.
